
Production managers, engineers, supervisors, buyers, estimators, cost accountants, QA/QC personnel, maintenance teams and industrial abrasive users
Purchase price; landed cost; consumable use; labour and machine time; changeover; inspection; rework; scrap; downstream effects; energy; waste; risk; comparison boundaries; accepted output; sensitivity and decision control.
Cost reduction must never depend on operating beyond a product limit, defeating a guard, extending use after damage, using an unsuitable accessory, reducing required extraction or inspection, or accepting uncontrolled rework. Follow the product marking, machine instructions, workplace risk controls and applicable Malaysian requirements.
The lowest-priced abrasive is not automatically the lowest-cost choice. Compare safe, technically acceptable options on the same process boundary and per unit of accepted output.
An abrasive is a relatively small purchased item that can influence a much larger manufacturing cost. Product life, stock-removal rate, finish consistency, operator effort, change frequency, rework and downstream preparation may outweigh a difference in unit price. A useful cost comparison therefore follows the complete operation from product receipt to accepted work.
Use current quotations, actual shop-floor observations and organisation-approved cost rates. Keep every candidate within its marked limits, intended use and approved machine arrangement. When an exact product value is required, Refer to the product label, Technical Data Sheet, or MKTECH representative.
Chapter objectives
After this chapter, the reader should be able to:
- distinguish unit price, landed cost, use cost and total process cost;
- define a fair comparison boundary and output unit;
- identify direct and indirect cost drivers;
- capture labour, machine, changeover and inspection time;
- include rework, scrap and downstream consequences;
- avoid double counting and false precision;
- compare products with different pack sizes and useful lives;
- apply safety and technical acceptance as decision gates; and
- prepare reliable inputs for cost per accepted component.
Start with the decision
State the question before collecting numbers. Typical decisions include:
- selecting between technically suitable abrasive products;
- reviewing an existing grinding or finishing sequence;
- deciding whether a higher-priced product reduces overall process cost;
- comparing a single product with a multi-step system; or
- evaluating a change in pack size, attachment or point-of-use method.
Keep the decision narrow enough to measure. “Reduce grinding cost” is vague. “Compare two approved fibre-disc systems for removing the same weld condition to the same accepted finish” creates a usable boundary.
Separate four levels of cost
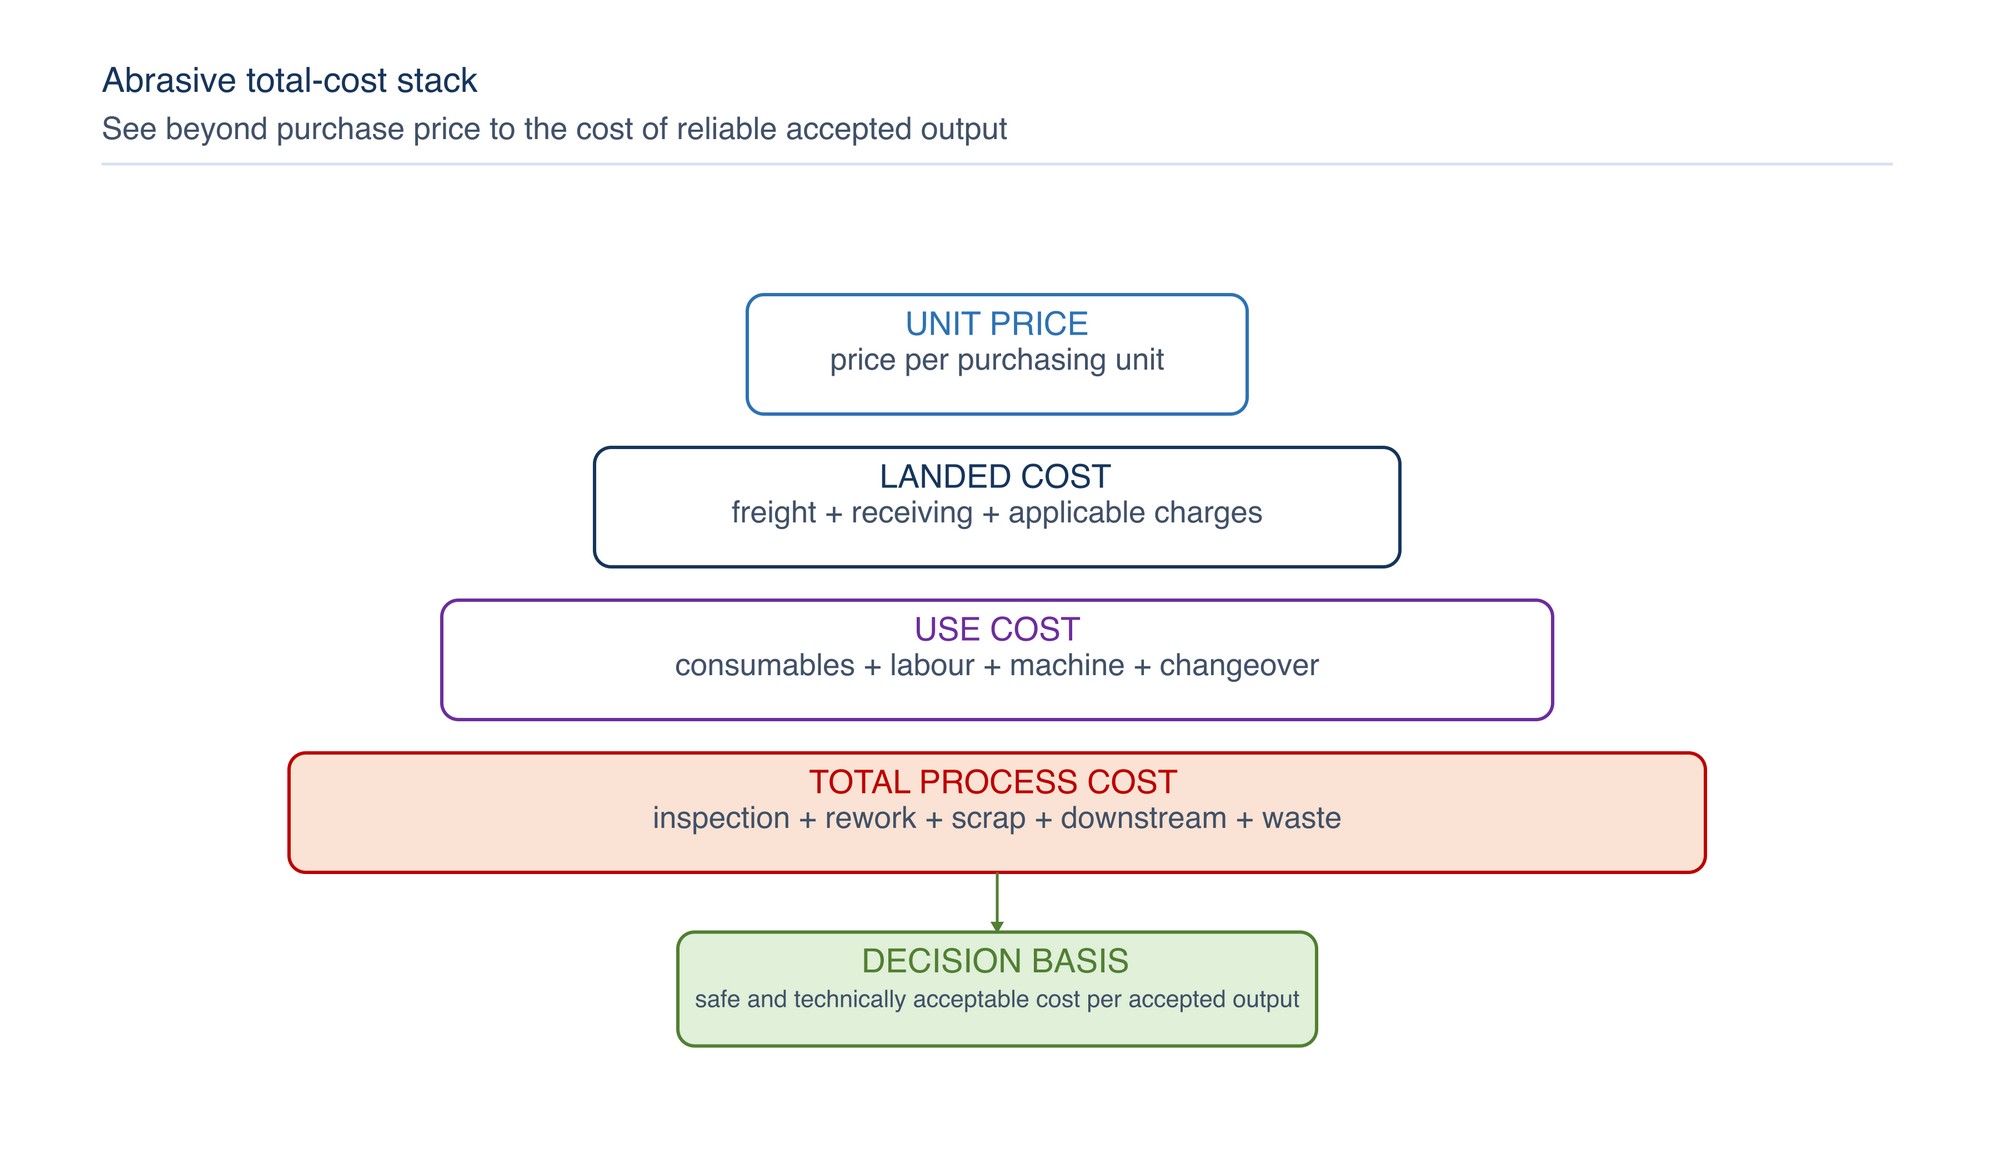
| Cost level | Typical content | Main question |
|---|---|---|
| Unit price | Price per disc, belt, wheel, sheet, roll or pack | What is paid for one purchasing unit? |
| Landed cost | Unit price plus freight, duties, taxes where applicable and receiving cost | What does usable stock cost at the store? |
| Use cost | Landed consumable cost plus accessories, labour, machine and changeover inputs | What does the operation consume? |
| Total process cost | Use cost plus inspection, rework, scrap, downstream correction, waste and disruption effects | What does accepted output cost? |
ASCM distinguishes per-unit cost, total landed cost and total cost of ownership when evaluating value. [S370] For abrasives, the practical focus is the controlled production process rather than ownership of a long-life asset.
Define the comparison boundary
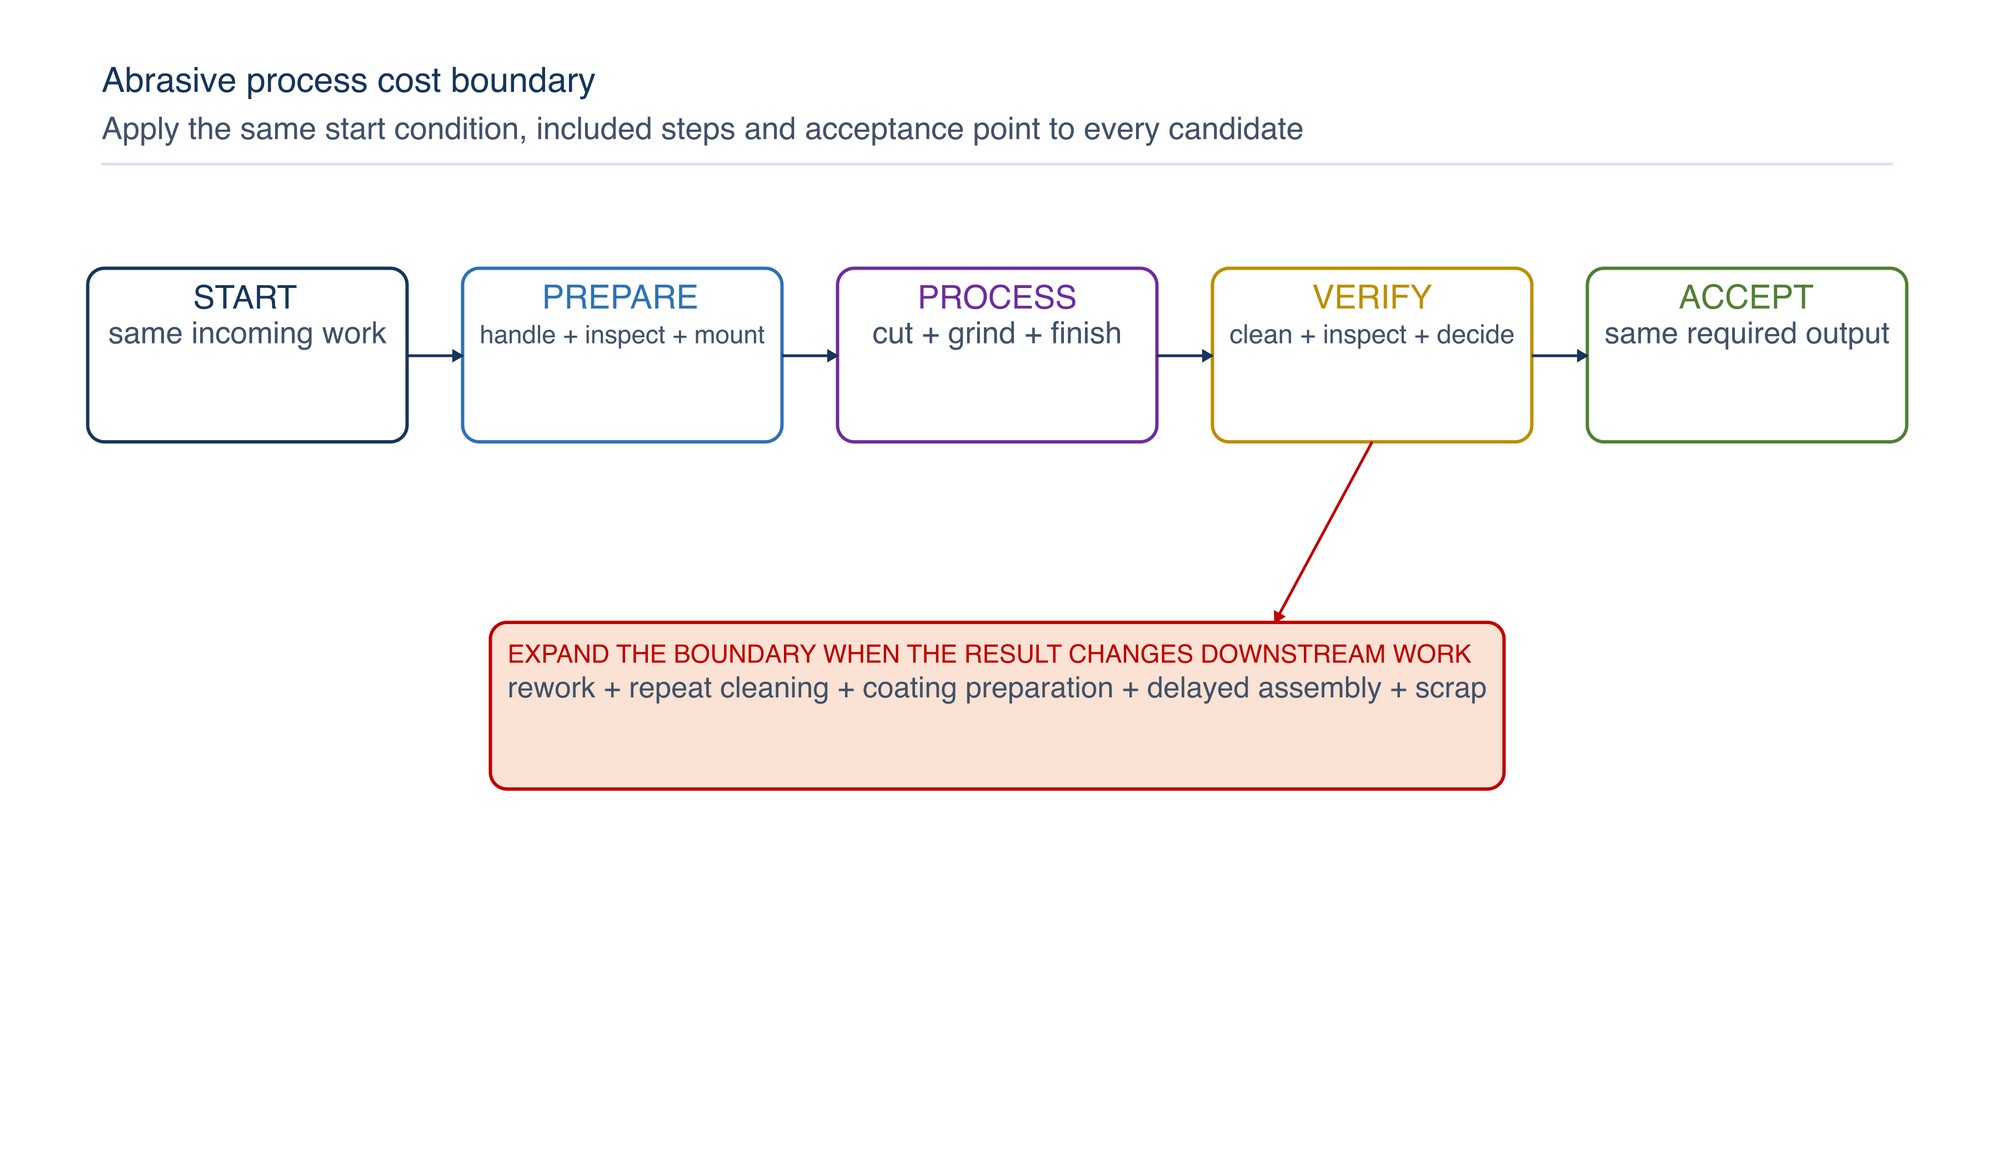
Define:
- the incoming workpiece condition;
- the first activity included;
- every grinding, cutting, blending, cleaning or inspection step included;
- the final acceptance requirement;
- the point at which time and cost stop;
- the production quantity or observation period; and
- any downstream process affected by the abrasive result.
A narrow boundary may conceal transferred cost. A faster grinding step is not a saving if it creates additional blending, cleaning, coating preparation or inspection. Expand the boundary far enough to capture material differences between candidates.
Choose an accepted-output unit
Select a denominator that represents useful production:
- accepted component;
- accepted metre of weld;
- accepted cut;
- accepted square metre of prepared surface;
- accepted edge or feature; or
- another clearly defined unit.
Avoid “cost per disc” as the main performance measure. It describes purchasing or consumption but not useful output.
Chapter 062 develops the full cost-per-accepted-component calculation.
Establish technical and safety gates
Cost comparison begins only after each candidate is suitable for the actual product, machine, accessory, workpiece and operation. Confirm product identity, dimensions, mounting, intended use, guard arrangement, speed compatibility, workpiece material, process requirement and applicable controls. [S350; S351; S352]
Reject or contain a candidate when it:
- cannot be positively identified;
- is damaged or unsuitable for use;
- does not match the machine or accessory arrangement;
- cannot meet the required result;
- introduces an unacceptable safety, contamination or quality risk; or
- requires operation outside controlled instructions.
A low calculated cost never overrides a safety or technical rejection.
Calculate comparable consumable cost
Convert every quotation to the same base:
Landed cost per usable abrasive = landed pack cost ÷ usable quantity in the pack
Then capture actual consumption within the defined boundary:
Abrasive cost for the comparison = landed cost per usable abrasive × quantity consumed
Include partial products only when their remaining useful quantity can be identified and used safely. Do not treat a discarded remnant as productive consumption.
Include supporting consumables and accessories
The abrasive may require:
- backing pads, contact wheels, flanges, adaptors or mandrels;
- dressing or truing tools;
- compounds, lubricants, coolant or cleaning materials;
- masking and protection materials;
- filters, extraction consumables or collection bags; and
- inspection consumables.
Allocate reusable accessory cost over an approved and observable basis. Replaceable backing pads or contact elements can materially affect both cost and result. Do not assume unlimited accessory life.
Measure productive labour
Labour time includes more than abrasive contact time. Observe:
- workpiece handling and positioning;
- product selection and inspection;
- mounting and adjustment;
- grinding, cutting or finishing;
- intermediate checking;
- cleaning between steps;
- product change;
- final inspection and handling; and
- permitted recovery or rest associated with the task method.
Use the organisation's approved labour-cost basis. Apply the same rate definition and time boundary to every candidate.
Capture machine and work-area time
Machine or workstation cost may include depreciation or lease, maintenance, utilities, extraction, floor space and controlled overhead according to the organisation's costing method.
Use:
Machine-time cost = measured included time × approved machine or workstation rate
Keep productive time, planned changeover and unplanned delay visible as separate fields. A single blended number can hide why one option performs differently.
Count changeover and preparation
Changing a disc, belt, wheel or compound can stop productive work and require isolation, inspection, cleaning, adjustment or a first-piece check. Capture:
- planned product changes;
- premature changes caused by loading, damage or loss of cut;
- tool or accessory changes between steps;
- dressing, conditioning or cleaning;
- reset and first-piece verification; and
- safe disposal or return of the removed product.
Compare a longer-lasting product against the full avoided change activity, not only the number of abrasives used.
Include inspection and appraisal
Inspection is part of process cost when it is necessary to confirm conformity. Depending on the work, this can include dimensional checks, visual standards, surface-texture measurement, cleanliness, edge condition, coating-readiness checks or documented release. [S343; S344; S345]
ASQ classifies measurement and monitoring activities as appraisal costs. It distinguishes these from prevention and failure costs. [S365] Record extra inspection caused by unstable output separately from routine required inspection.
Make rework and scrap visible
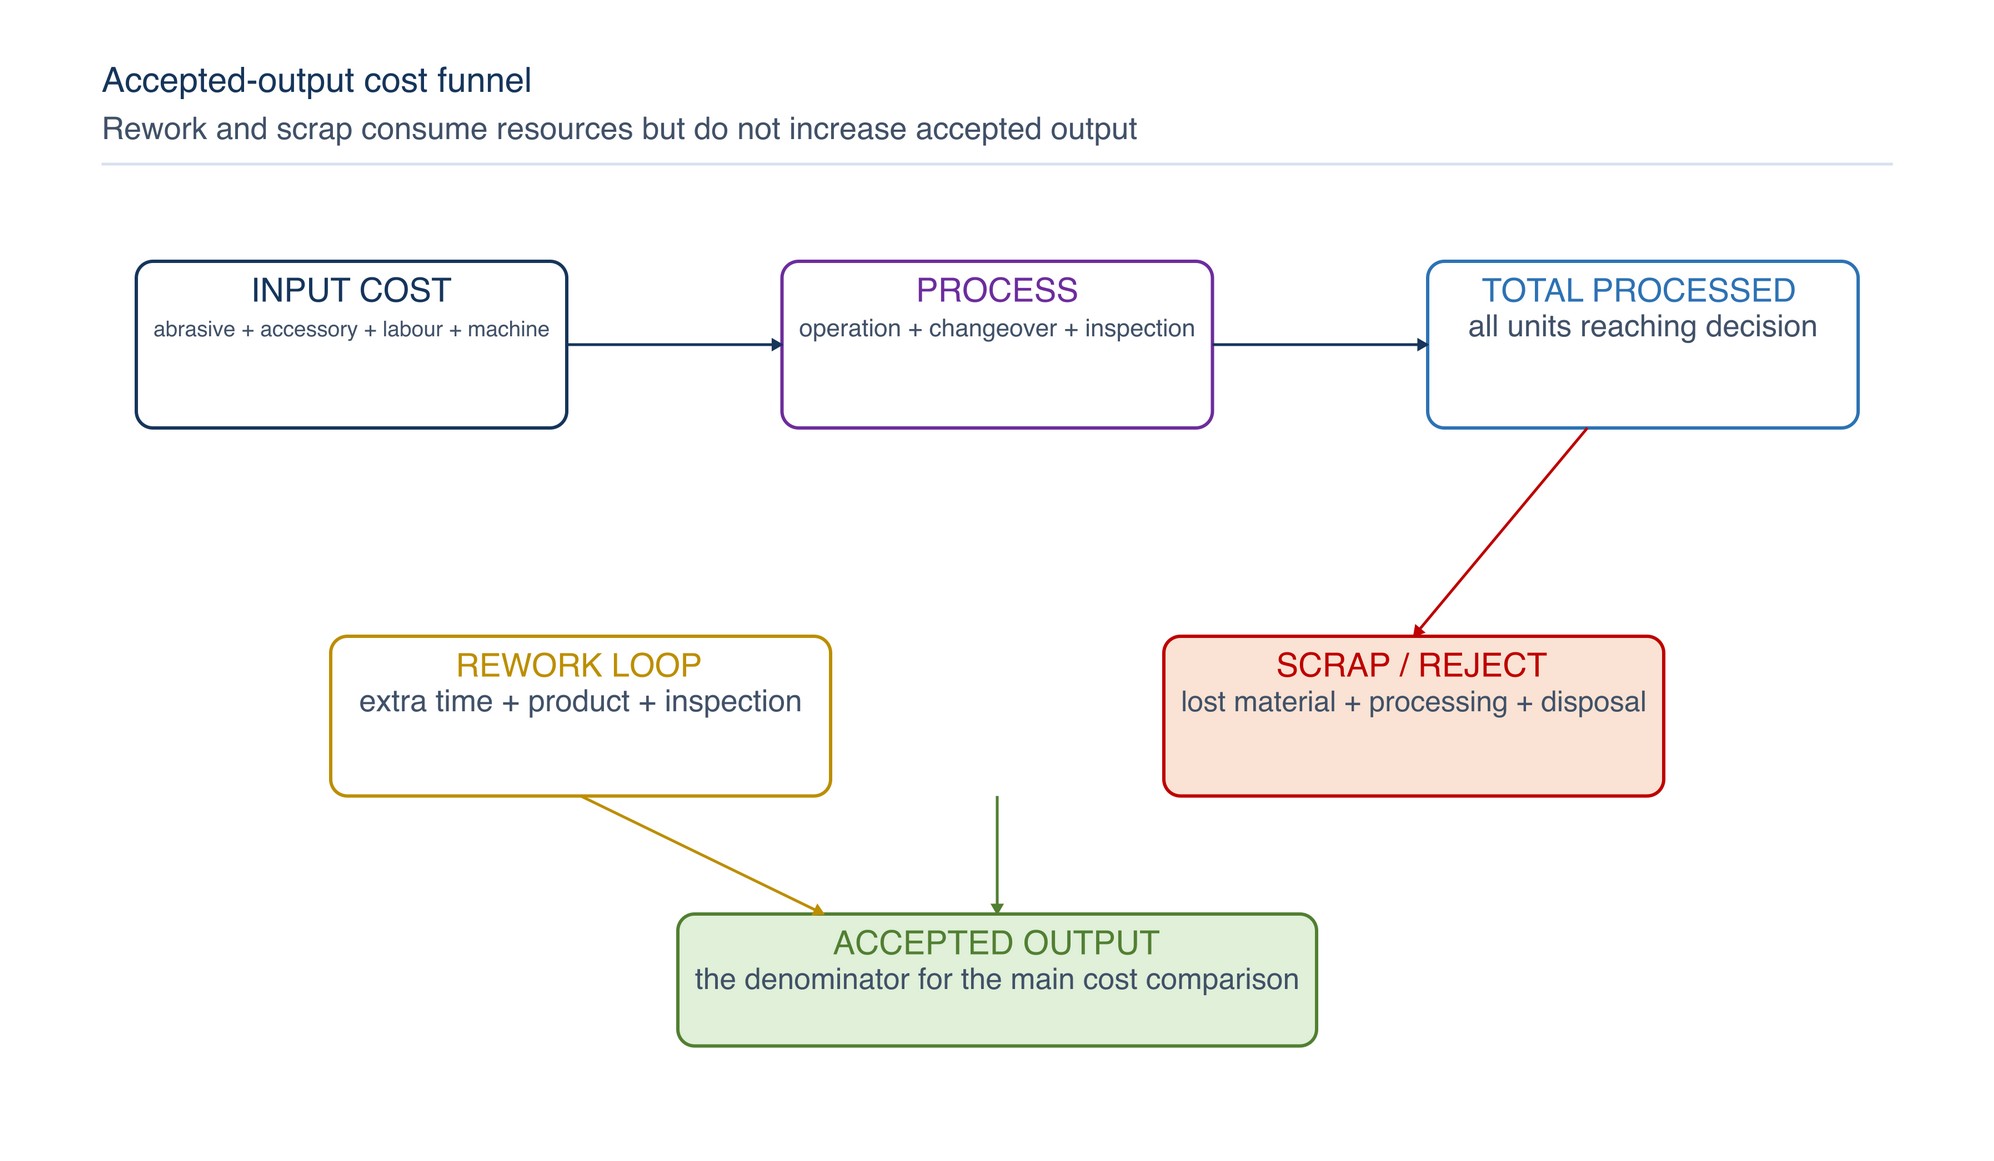
Internal failure cost can include:
- repeated grinding or blending;
- correction of scratches, gouges, geometry loss or heat effect;
- replacement material;
- repeated cleaning or coating preparation;
- extra inspection and handling;
- scrap and disposal; and
- investigation and production interruption.
ASQ identifies rework and scrap as internal failure costs. [S365] Allocate rework labour, machine time, consumables and any replacement material only once.
Consider downstream consequences
The abrasive result may affect welding, coating, assembly, sealing, dimensional fit, corrosion performance or visual acceptance. Record a downstream cost only when the link is technically credible and the boundary includes it.
Examples include:
- an additional blending step;
- repeat cleaning before coating;
- coating defects linked to surface preparation;
- dimensional correction after excessive stock removal;
- delayed assembly due to rejected finish; or
- special segregation or cleaning for contamination control.
Do not assign a monetary consequence from assumption alone. Use confirmed events and approved costing rules.
Track material, energy and waste
ISO 14051 describes tracing material flows in physical units and evaluating the costs associated with those flows. [S369]
Apply this principle to abrasive consumption, removed material where relevant, scrap components, packaging, collection media and waste handling.
Energy can be included when the measurement basis is consistent and material to the decision. Avoid false precision from estimated tool power multiplied by elapsed time when actual load, duty cycle and system efficiency are unknown.
Use cost-of-quality categories carefully
| Category | Abrasive-process examples | Control against double counting |
|---|---|---|
| Prevention | Procedure development, training, product approval, fixture improvement | Treat as a defined improvement investment |
| Appraisal | Incoming checks, in-process measurement, final inspection | Separate routine inspection from extra checks |
| Internal failure | Rework, scrap, repeated cleaning, failure analysis | Include before customer release |
| External failure | Return, complaint handling, field correction, replacement | Include only confirmed attributable events |
Cost-of-quality analysis helps reveal where resources prevent, detect or correct poor quality. [S365] It should guide improvement, not encourage removal of necessary prevention or inspection.
Build a controlled cost model
Use a transparent relationship:
Total included process cost = abrasive + supporting consumables + labour + machine/workstation + changeover + inspection + rework + scrap + downstream + waste/disposal + other agreed costs
Label every input with:
- definition and unit;
- source;
- observation period;
- owner;
- inclusion rule;
- allocation method where shared; and
- revision date.
ISO 10014 links financial and economic improvement to monitored performance metrics and action based on observed results. [S366] ISO 22400 provides an industry-neutral framework for defining and using manufacturing KPIs. [S367; S368]
Compare candidates fairly
| Control | Fair comparison | Weak comparison |
|---|---|---|
| Workpiece | Same material, geometry and initial condition | Mixed jobs or unknown condition |
| Requirement | Same measurable acceptance point | “Looks better” without a reference |
| Machine | Same suitable machine class and controlled setup | Different power, support or maintenance state |
| Method | Trained operators and defined sequence | Uncontrolled technique changes |
| Product use | Defined change-out rule and complete identity | Run one product longer to favour it |
| Time | Same start/stop rules | Contact time for one option, elapsed time for another |
| Output | Accepted units | Total processed units including rejects |
| Cost rates | Same approved basis and date | Mixed quotation dates or accounting bases |
Where learning effects are likely, stabilise the method before drawing a commercial conclusion.
Test sensitivity and uncertainty
Cost inputs vary. Product consumption, cycle time, rework and demand may not be constant. Show a reasonable range using observed low, typical and high cases or another approved method.
Ask:
- Does the ranking change when labour time varies?
- Does it depend on one unusual reject?
- Is a longer-life result repeatable?
- Would a price or pack-size change reverse the decision?
- Is the apparent saving larger than the uncertainty in the data?
Avoid presenting more decimal places than the input quality supports.
Read the result with risk and capacity
The lowest calculated total cost is important, but it is not the only decision factor. Review:
- technical conformity and finish stability;
- safety and ergonomics;
- process capability and repeatability;
- available production capacity;
- change-management effort;
- inventory and continuity implications; and
- confidence in the data.
ISO 55001 frames decisions around performance, risk and expenditure. [S337] A modest cost difference may not justify a large operational risk, while a higher unit price may be justified by reliable accepted output or released capacity.
Review and improve
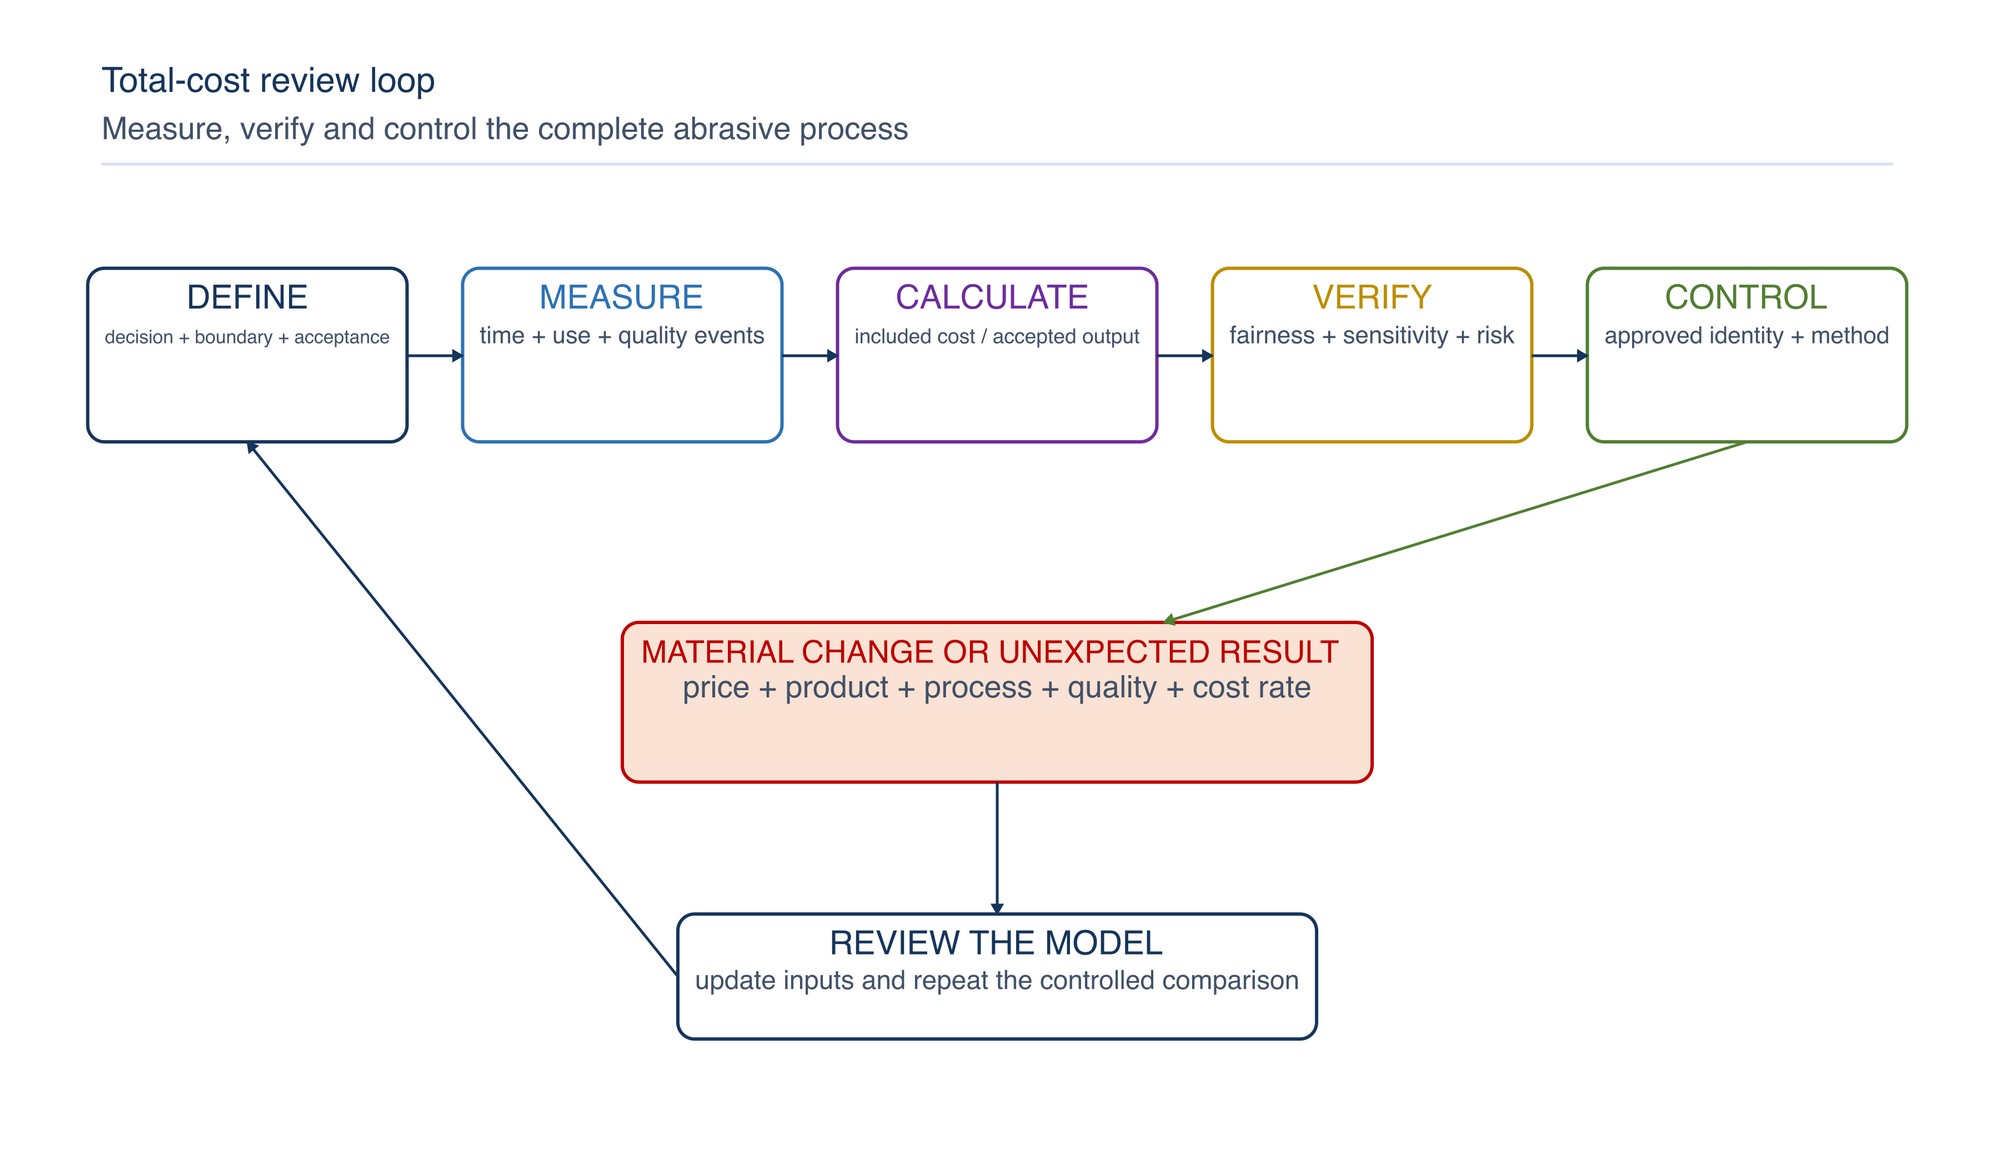
Repeat the review when product identity, price, pack size, process sequence, workpiece, machine, acceptance requirement, cost rate or demand pattern changes materially.
Keep the selected method controlled through:
- approved product identity;
- current work instruction;
- operator competence;
- consistent change-out criteria;
- defined inspection;
- consumption and time records; and
- periodic review of actual cost drivers.
Practical decision checklist
Before accepting a total-cost comparison, confirm:
- all candidates passed technical and safety gates;
- the same start and acceptance points were used;
- quotations and pack conversions are current;
- all major consumables and accessories are included;
- labour, machine and changeover time use the same definitions;
- accepted output—not total processed quantity—is the main denominator;
- rework, scrap and downstream correction are visible;
- shared costs use a stated allocation basis;
- no cost is counted twice;
- variability and exceptional events are explained; and
- the conclusion remains valid across a reasonable sensitivity range.
Troubleshooting
| Problem | Likely cause | Improvement |
|---|---|---|
| Lowest unit price gives highest process cost | High consumption, slow work or frequent changes | Expand the comparison to complete use cost |
| Candidate appears fast but rework rises | Acceptance point or technique is uncontrolled | Reinstate the same measurable quality gate |
| Cost per part changes sharply between shifts | Mixed work, operator method or change-out rule | Stratify data and standardise the method |
| Consumable cost looks unrealistically low | Pack conversion, partial use or scrap product omitted | Reconcile receipt, issue and actual consumption |
| Labour saving cannot be reproduced | Timing boundary or learning effect differs | Use common start/stop rules and repeat observations |
| Machine-cost result dominates everything | Rate includes costs outside the decision boundary | Review the approved allocation basis |
| Failure cost also remains inside blended overhead | Rework is counted twice | Map every cost once to the model |
| Energy estimate shows false precision | Nameplate power used as actual load | Measure consistently or treat as a sensitivity item |
| Saving depends on one exceptional job | Sample is unrepresentative | Extend observation across normal variation |
| Cheaper option fails safety or compatibility review | Cost was considered before technical acceptance | Apply the safety and suitability gate first |
Safety reminder
Cost reduction must never depend on operating beyond a product limit, defeating a guard, extending use after damage, using an unsuitable accessory, reducing required extraction or inspection, or accepting uncontrolled rework. Follow the product marking, machine instructions, workplace risk controls and applicable Malaysian requirements.
Key takeaways
- Unit price is only the first layer of abrasive process cost.
- Define the same process boundary and accepted-output unit for every candidate.
- Include consumables, labour, machine time, changeover, inspection, rework, scrap and downstream effects where material.
- Use actual observations and approved cost rates.
- Keep technical suitability and safety as gates.
- Show uncertainty and avoid double counting.
- Select and control the option that delivers reliable accepted output at the best total process value.
Calculating Cost per Accepted Component
The full cost-per-accepted-component calculation is developed in the following chapter of the printed handbook (page 562), outside this chapter extract.