

Factory managers, production engineers, supervisors, QA/QC teams, maintenance personnel, planners, buyers and continuous-improvement teams
KPI purpose and governance; accepted output; safety and control; quality; flow; labour; abrasive consumption; equipment; cost; data segmentation; visual management; response and review.
No productivity, availability, labour, consumption or cost KPI overrides product marking, machine limits, guarding, mounting, extraction, secure workholding, inspection, PPE or stop-work conditions. Never reward an operator for suppressing an abnormal event or using an abrasive beyond its safe condition.
A useful KPI supports a defined decision and protects the whole result. Grinding output is not successful unless the work is safe, conforming, traceable and economical.
Abrasive operations can look productive while creating hidden rework, excess product use, equipment damage or downstream defects. A balanced measurement system makes these trade-offs visible. It uses a small set of clearly defined indicators, based on comparable work and reliable data, with an agreed response when performance changes.
This chapter provides a practical KPI framework, not universal factory targets. When an exact product value is required, Refer to the product label, Technical Data Sheet, or MKTECH representative.
Chapter objectives
After this chapter, the reader should be able to:
- select KPIs from operational decisions and risks;
- create a controlled definition for every measure;
- use accepted output as a common denominator;
- balance safety, quality, flow, labour, abrasive use and cost;
- separate leading controls from lagging results;
- prevent misleading aggregation and metric gaming;
- interpret trends, variation and defect concentration;
- define review limits from local requirements and baselines;
- build a practical tiered dashboard; and
- turn an abnormal signal into controlled improvement.
Begin with the decision
Before creating a KPI, state what decision it should support. Examples include:
- Is the process producing accepted output consistently?
- Is a defect increasing, and where is it originating?
- Is abrasive consumption changing after a material or method change?
- Is labour being lost to rework, setup, waiting or product changes?
- Is equipment condition interrupting stable production?
- Has a controlled trial improved total process performance?
NIST research describes KPI assessment as a stakeholder-based activity linked to organisational value, rather than an ad hoc collection of available measures. [S387] If nobody knows what action follows a signal, the measure is probably a report item rather than a key indicator.
Build a balanced KPI tree
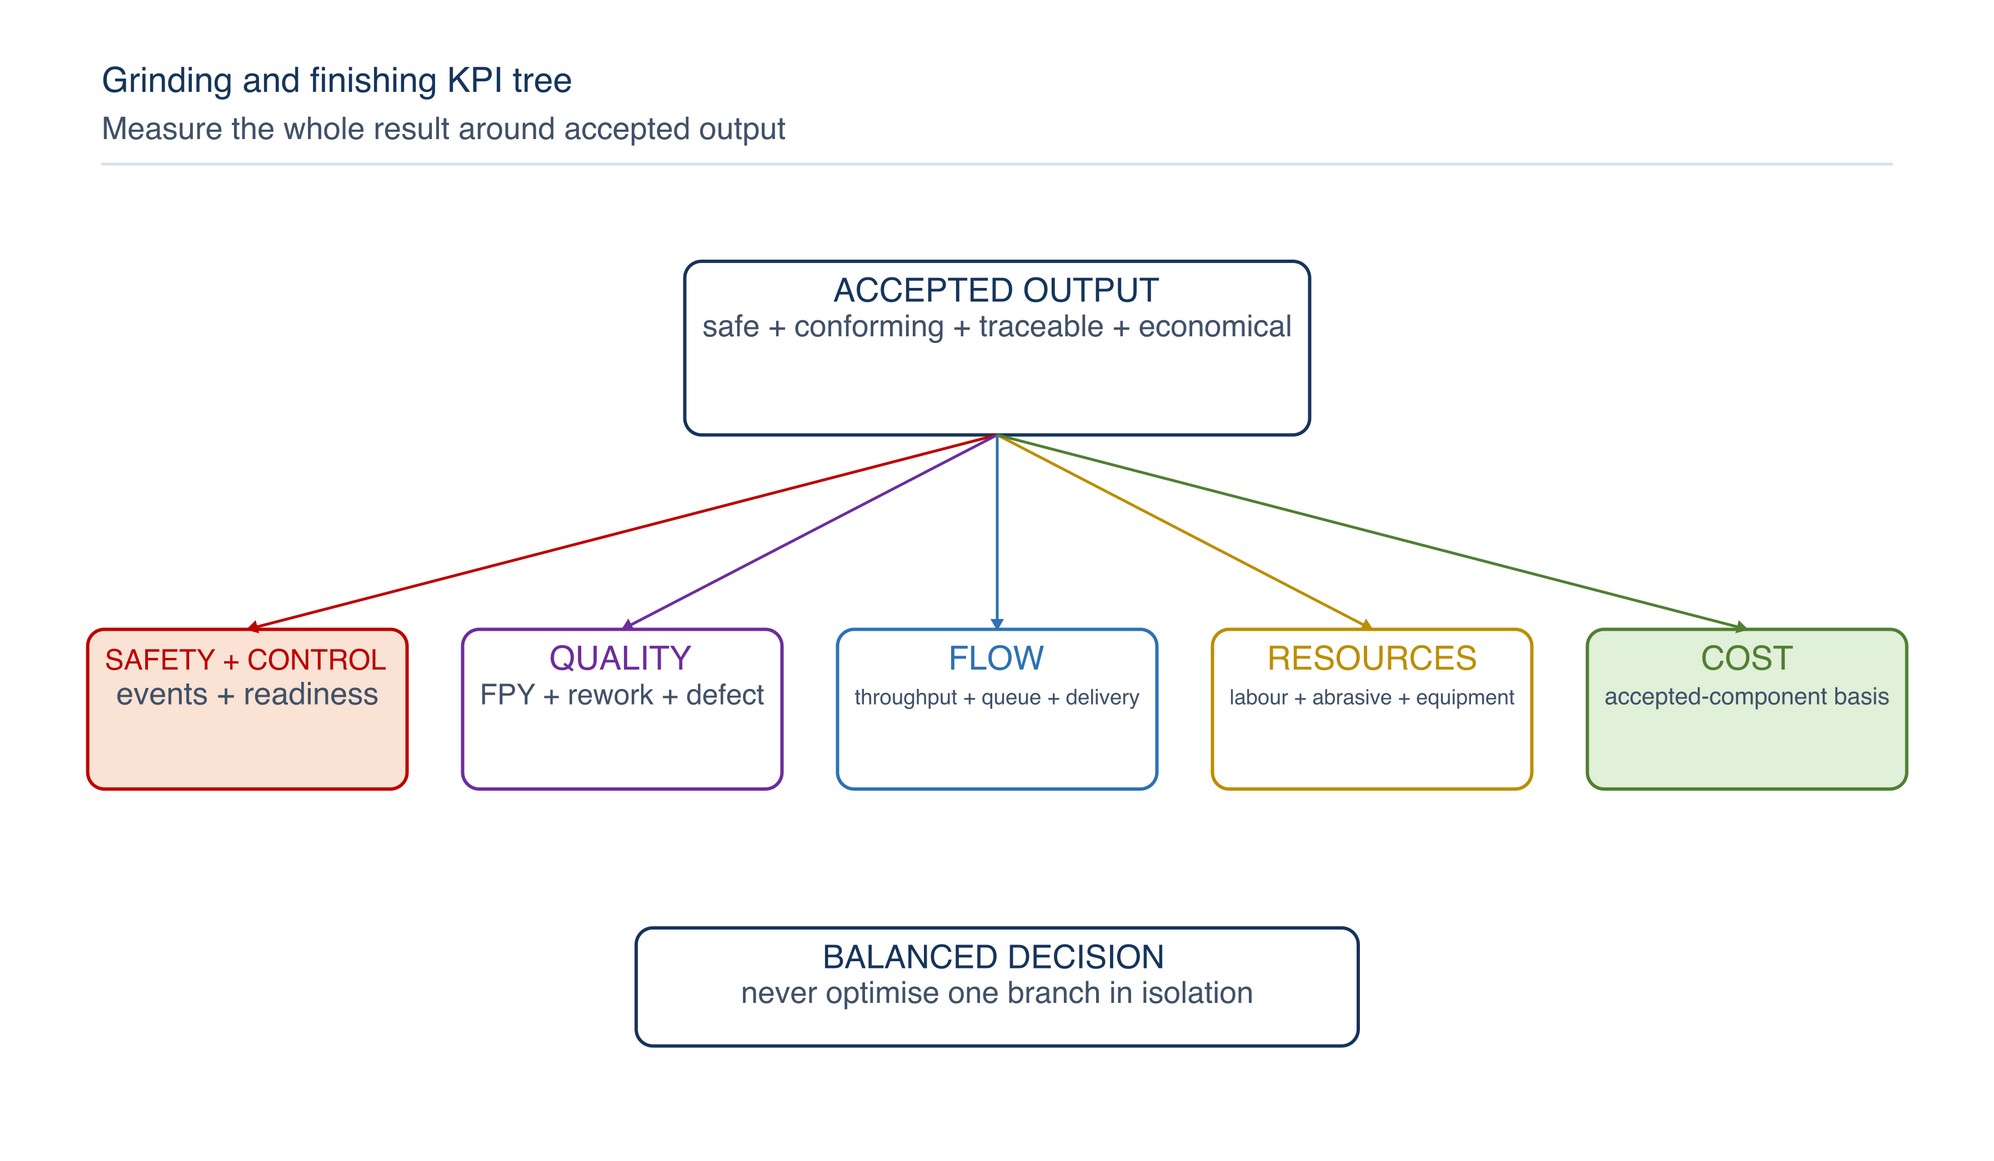
Use five connected result families:
| Family | Core question | Example indicators |
|---|---|---|
| Safety and control | Was work performed within the approved system? | Abnormal events, pre-use control completion, extraction availability |
| Quality | Did work pass the required checks first time? | First-pass yield, rework, scrap, defect family |
| Delivery and flow | Did accepted work move as planned? | Accepted throughput, lead time, queue time, schedule completion |
| Resources and stability | What input was used and where was time lost? | Labour, abrasive use, product changes, downtime |
| Cost | What did each accepted result consume? | Cost per accepted component, rework cost, material loss |
Do not optimise one branch in isolation. Higher output with falling first-pass yield or rising abnormal events is not a sustained improvement.
Control the KPI definition
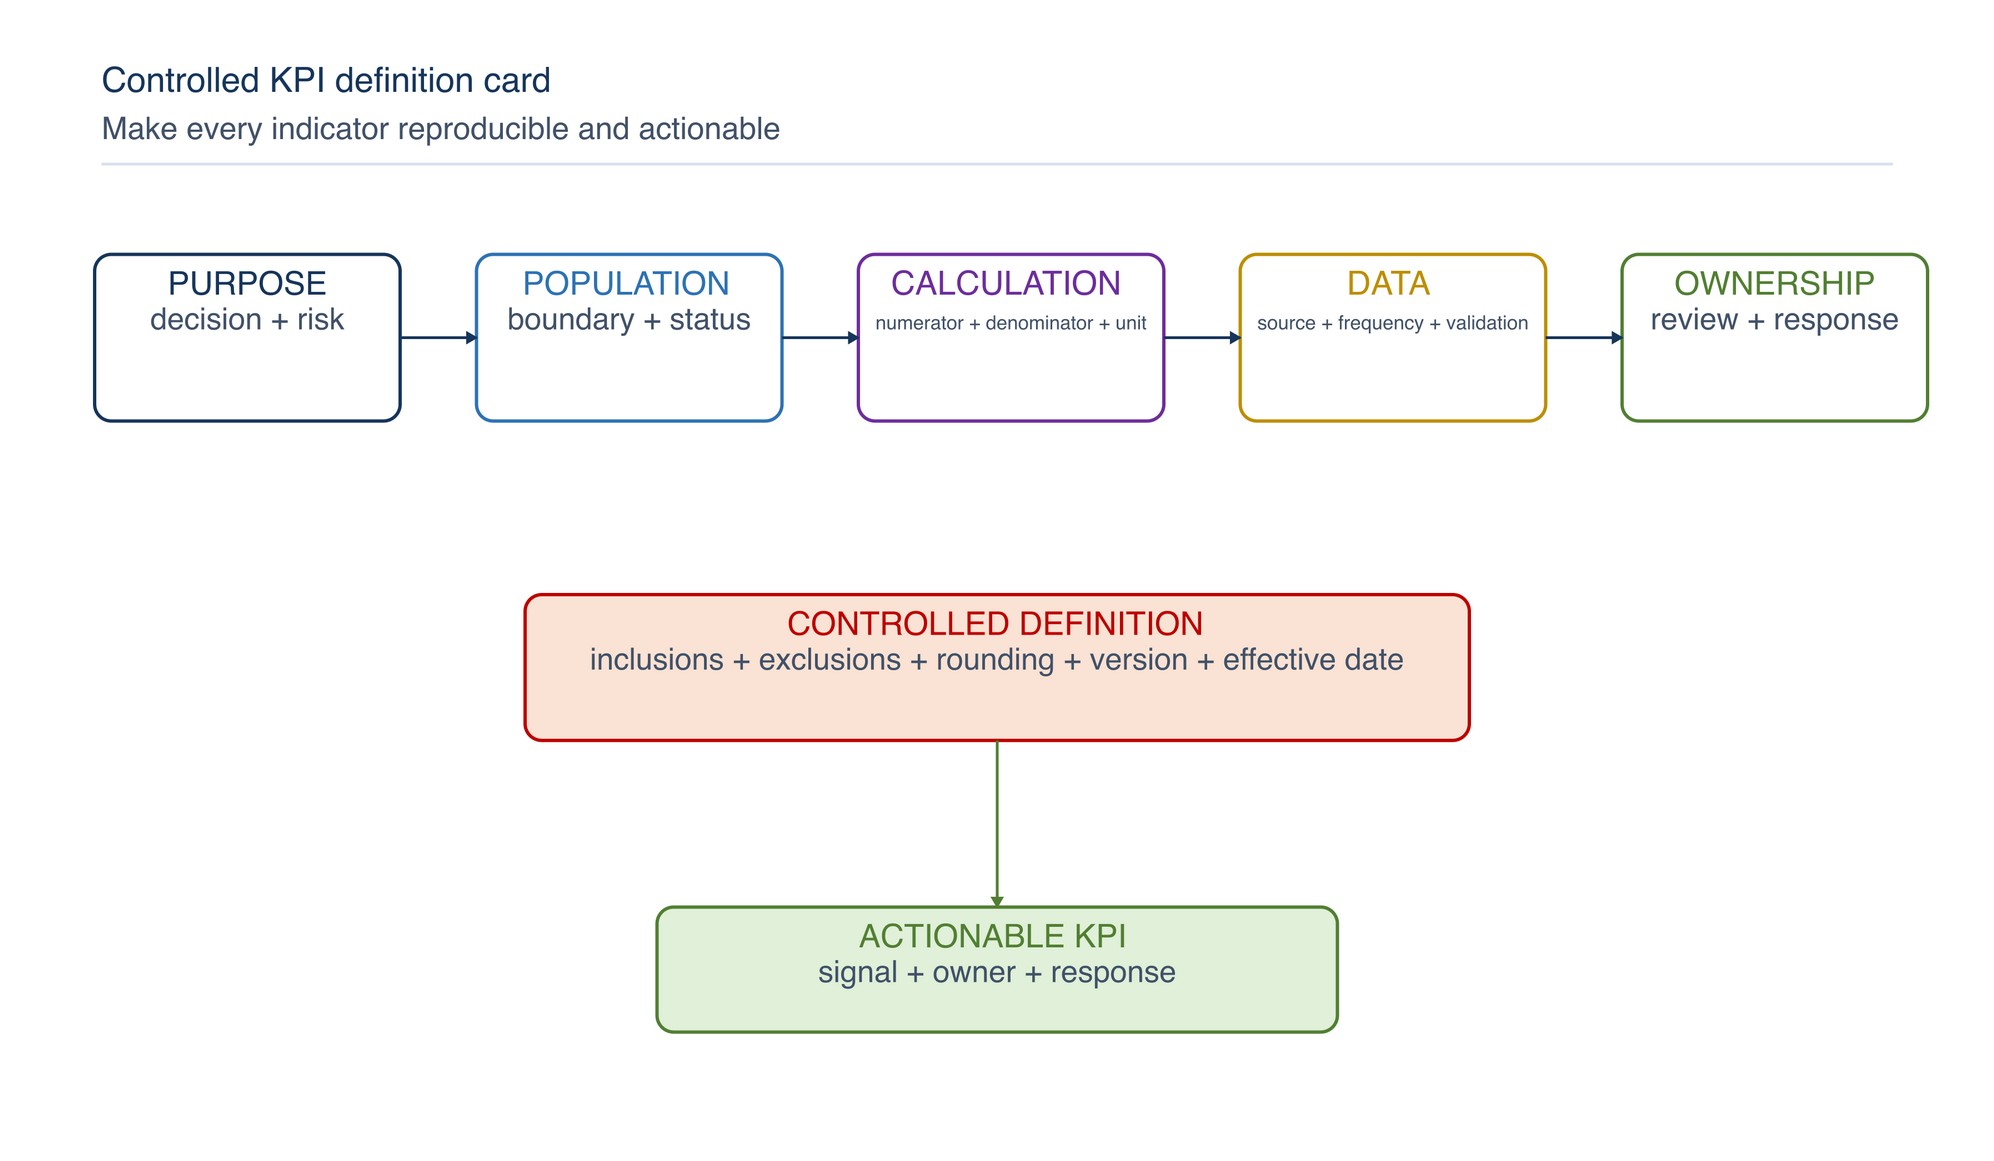
Every KPI needs a controlled definition:
- name and business purpose;
- question or decision supported;
- process boundary and population;
- numerator and denominator;
- included and excluded statuses;
- unit and rounding rule;
- source systems or records;
- collection and reporting frequency;
- responsible owner and reviewer;
- applicable requirement or baseline;
- response to an abnormal result; and
- definition version and effective date.
ISO 22400 provides an industry-neutral framework for defining, composing and using manufacturing-operations KPIs. [S367; S368] This handbook uses transparent shop-floor measures without reproducing proprietary standard tables.
Use accepted output as the common denominator
Define output by final status:
- accepted first pass;
- accepted after in-line correction;
- accepted after off-line rework;
- concession or deviation where authorised;
- scrap; and
- unresolved or quarantined.
Where suitable:
Resource per accepted unit = resource used within the boundary ÷ final accepted units
The resource may be direct labour time, abrasive units, energy or total process cost. For continuous work, use accepted length or area. State the unit and keep product family, material and task difficulty visible.
Do not count a partly processed item as accepted output merely because it left the workstation.
Separate leading and lagging indicators
Leading indicators show whether controls are in place before loss occurs. Lagging indicators show results after production.
| Leading control | Related lagging result |
|---|---|
| Correct product and accessory verified | Product-related defect or consumption |
| Machine and extraction ready | Downtime, abnormal event or repeat pass |
| First-result check completed | Batch rework or late defect detection |
| Standard work and training current | Method variation and labour spread |
| Workholding condition confirmed | Geometry, chatter or finish defect |
| Measurement equipment in controlled status | Invalid acceptance or repeat inspection |
Use leading measures to manage the process and lagging measures to verify the outcome. A completed checklist is not proof of conformity, and a good monthly result does not prove every required control was present.
Safety and control indicators
Suitable measures may include:
- abrasive, guard, mounting or machine abnormalities reported;
- work stopped for damage, vibration or loss of control;
- extraction unavailable during scheduled work;
- pre-use or first-result control completed;
- overdue machine or accessory condition action;
- unplanned deviation from standard work; and
- corrective actions open beyond their workplace due date.
Use event classification and narrative review rather than chasing a low number. Under-reporting is worse than a visible problem. ISO 45001 supports worker participation, hazard control and continual improvement. [S359]
No generic event target or exposure limit is supplied by this handbook. Applicable Malaysian legal duties and workplace risk controls govern.
First-pass yield
First-pass yield shows the proportion of input that completes the defined process and meets its quality requirements without scrap, rerun, retest, return or off-line repair. [S372]
For a clearly defined process:
First-pass yield = first-pass accepted units ÷ units entering the process
State how in-line correction is treated. A brief correction before handoff may be operationally different from off-line rework, but it still consumes time and should not disappear from the record. Use the same rule across the comparison.
For multiple sequential operations, report each operation and the final route result. A high average can hide one weak stage.
Rework, scrap and concession
Track these outcomes separately:
| Status | Meaning | Recommended companion measure |
|---|---|---|
| Rework | Additional authorised processing to meet the original requirement | Rework labour and defect family |
| Scrap | Work cannot or will not be recovered to accepted status | Material and processing cost already consumed |
| Concession/deviation | Nonconforming condition accepted by authorised decision | Reason, scope and customer/quality authority |
| Quarantine | Status is unresolved | Age, quantity and decision owner |
Do not improve apparent yield by relabelling repair, blending, retest or concession as first-pass work.
Defect-family indicators
Use consistent categories that describe the observed condition:
- scratch, gouge or handling mark;
- heat tint, burn or distortion;
- residual burr or sharp edge;
- excessive material removal or geometry change;
- uneven texture, gloss or directional finish;
- embedded contamination or residue;
- missed feature or incomplete coverage;
- cut deviation, breakout or poor edge condition; and
- downstream adhesion or coating-preparation failure.
Report both count and affected output basis. A rare defect may be high risk; a frequent cosmetic correction may dominate labour. Keep severity and occurrence distinct.
Accepted throughput and flow
Measure accepted output per defined working period, not gross starts. Useful supporting measures include:
- queue time before grinding or finishing;
- processing time within the operation;
- waiting for product, fixture, information or inspection;
- move and handling time;
- work-in-process quantity and age; and
- schedule completion for released work.
ISO 18828-4 supports multi-level KPI organisation in production planning, while its scope is series production. [S388] For job shops and repair work, segment by comparable route or work family rather than forcing a series-production model.
Labour indicators
Use Chapter 065’s defined boundary:
Direct labour per accepted unit = direct labour time ÷ final accepted units
Also record:
- rework labour;
- setup and changeover labour;
- inspection and necessary support time;
- search, movement and waiting loss; and
- assistance or handling labour for large components.
Labour per unit should fall because avoidable work is removed—not because workholding, inspection, rest, extraction or safe handling is weakened.
Abrasive-use indicators
Use Chapter 064’s approach:
Abrasive consumption per accepted unit = abrasive units consumed ÷ final accepted units
Companion indicators may include:
- premature change-out;
- loading or glazing occurrence;
- damage before use or during mounting;
- usable partials returned;
- unreconciled issue; and
- abrasive changes per accepted unit.
A lower disc count is not automatically better. Review task time, accepted quality, operator force, rework and safe discard condition together.
Equipment and downtime indicators
Classify lost equipment time by cause:
- machine fault or maintenance;
- guard, flange, pad, contact wheel or accessory condition;
- extraction or utility unavailable;
- setup, adjustment or first-result release;
- material, drawing, fixture or inspection unavailable; and
- planned non-production time.
Availability should use an explicitly defined scheduled-time basis. Overall equipment effectiveness combines availability, performance and quality concepts, but it is not a complete measure of manual grinding quality, ergonomics, abrasive consumption or total cost. ASQ describes OEE in terms of operational availability, performance efficiency and first-pass yield. [S372]
Do not calculate OEE merely because the software provides it. Use it only when component factors and the production context are trustworthy.
Cost indicators
Chapter 062 defines:
Cost per accepted component = total process cost within the boundary ÷ final accepted components
Keep visible:
- abrasive and accessory cost;
- direct labour;
- machine and energy allocation;
- inspection and normal support;
- rework and scrap;
- disposal and material loss; and
- downstream loss attributable to surface preparation.
ASQ’s cost-of-quality framework distinguishes prevention, appraisal and failure costs. [S365] More prevention or early inspection cost can be economically sound when it reduces internal or external failure.
Segment comparable work
A factory-wide average may mix thin sheet, heavy weld removal, stainless finishing, casting cleanup and cutting. Segment by factors that materially affect the work:
- component or work family;
- material and incoming condition;
- operation and finish requirement;
- abrasive form and controlled product identity;
- machine and support accessory;
- manual, semi-automatic or mechanised method;
- shift, team or operator where appropriate; and
- new setup, repeat job or change condition.
Protect personal data and use operator segmentation to identify system support and training needs, not to publish unfair rankings.
Protect measurement quality
Confirm that data is complete, traceable and fit for its decision. ISO 10012 requires a managed measurement system that supports confidence in valid and reliable results. [S375]
Check:
- status definitions are understood;
- timestamps use the same boundary;
- counters reset and accumulate correctly;
- manual entries use permitted values;
- measurement equipment is controlled where required;
- rejected and reworked units are not double-counted;
- late entries are reconciled;
- downtime categories are mutually understandable; and
- formula and dashboard versions are controlled.
A precise chart built on inconsistent status codes is not reliable evidence.
Use trends and distributions
An average alone hides spread. Review:
- values over time in production sequence;
- median and range where suitable;
- distribution across comparable jobs;
- first-pass and rework paths separately;
- defect Pareto by frequency, labour and cost;
- product/machine combinations; and
- annotations for planned changes or abnormal events.
Do not react to every single fluctuation. First confirm data validity, product mix and known special causes. Investigate a sustained shift, unusual pattern or high-consequence event under the workplace response rule.
Set review limits locally
Use these inputs, in order:
- safety, legal, customer and drawing requirements;
- product and machine limits;
- approved process and quality-plan conditions;
- stable representative baseline and demonstrated capability;
- business objectives and improvement priorities; and
- controlled-trial evidence for a proposed change.
Do not copy an internet benchmark into a production target. A target without a comparable boundary, population and acceptance rule can drive the wrong behaviour.
Build a tiered dashboard
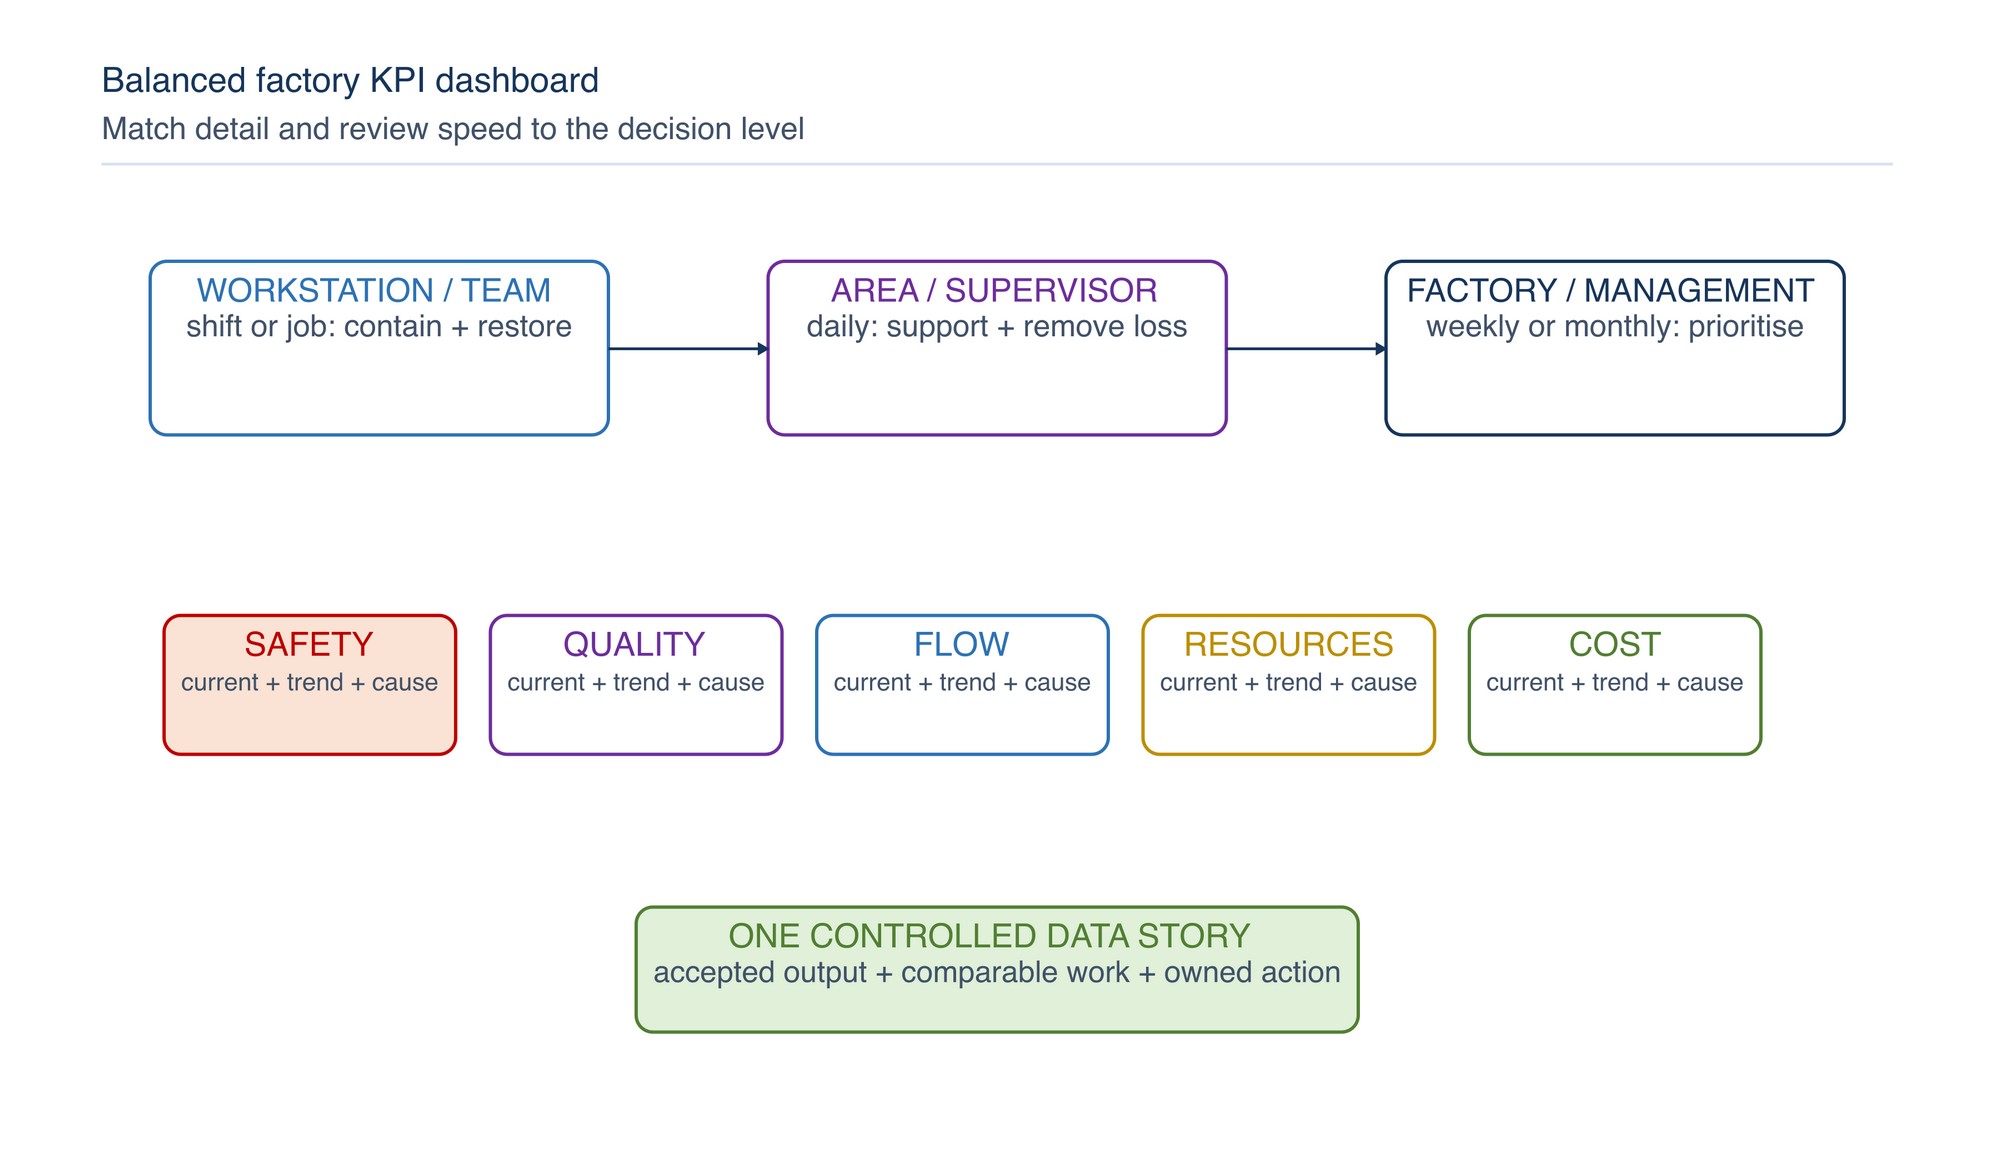
| Review level | Frequency | Useful content | Expected decision |
|---|---|---|---|
| Workstation/team | Shift or job | Safety status, first result, output, defect, downtime cause | Contain and restore control |
| Area/supervisor | Daily or scheduled | FPY, rework, labour, abrasive use, flow and open action | Allocate support and remove recurring loss |
| Factory/management | Weekly or monthly | Trends, major defect/cost families, capacity risk, improvement status | Prioritise resources and approve change |
Frequency should match risk, volume and decision speed. High-risk abnormalities require immediate response and should not wait for the dashboard meeting.
Use a concise display with current value, local reference, trend, status, cause and action owner. Avoid decorative charts that do not change a decision.
Respond to an abnormal signal
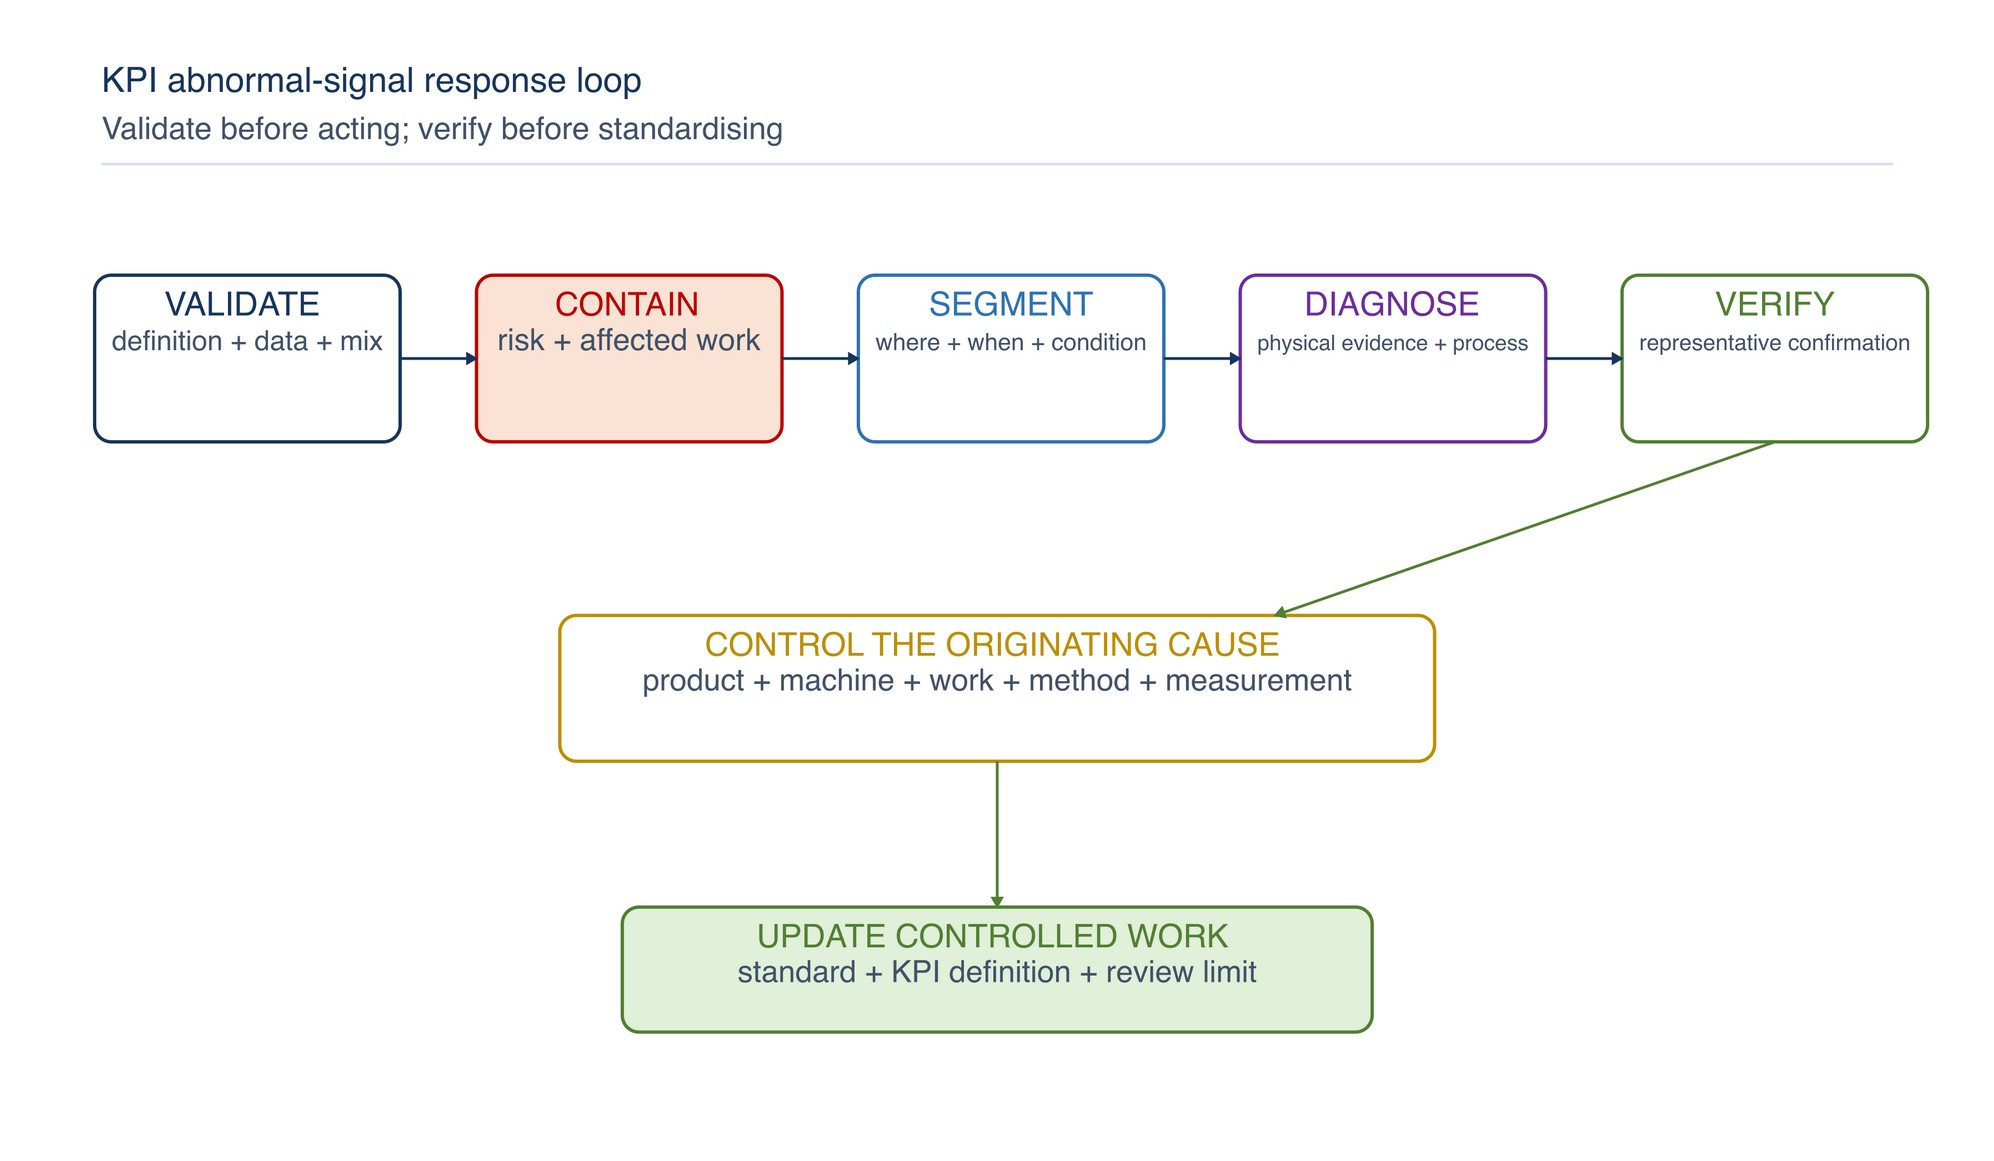
Use this sequence:
- verify the data definition, completeness and calculation;
- check whether product mix or process boundary changed;
- contain affected work or unsafe conditions;
- segment the signal to find where and when it occurs;
- inspect physical evidence, equipment and standard-work conditions;
- identify and control the originating cause;
- verify the action on representative work; and
- update the metric definition, work standard or review limit if approved.
Do not change the abrasive specification from a dashboard result alone. Use the controlled product-trial method in Chapter 063 when selection or method change is proposed.
Practical KPI-definition checklist
Confirm:
- the measure supports a named decision;
- the process boundary and population are explicit;
- accepted, rework, scrap, concession and quarantine statuses are separate;
- numerator, denominator, unit and rounding are controlled;
- source data and responsible owner are known;
- product mix and task difficulty remain visible;
- safety, quality, flow, resource and cost measures are balanced;
- leading controls and lagging results are distinguished;
- local review limits have an applicable basis;
- abnormal signals trigger a defined response;
- formulas, dashboards and definitions have revision control; and
- no KPI rewards unsafe speed, overuse or reduced acceptance control.
Troubleshooting
| Problem | Likely cause | Improvement |
|---|---|---|
| Output rises while customer defects rise | Gross output is used instead of accepted output | Restore quality status to the denominator |
| FPY looks high but rework labour is rising | In-line correction is hidden | Define and record correction consistently |
| Abrasive use varies sharply | Product mix or issue/return status is uncontrolled | Segment work and reconcile consumption |
| OEE rises but finishing cost increases | Equipment metric omits labour, abrasive and rework measures | Add accepted-component resource and cost measures |
| Factory average is stable but one cell struggles | Incomparable work is aggregated | Segment by work family, material and operation |
| Dashboard values are disputed | Definitions or source fields differ | Issue a controlled KPI definition card |
| Teams stop reporting abnormalities | Low event count is rewarded | Measure reporting and corrective response quality |
| Every fluctuation causes an adjustment | Natural variation is treated as a special cause | Review trend, mix and evidence before changing |
| Target is achieved through over-processing | Finish requirement is unclear | Link KPI to controlled acceptance criteria |
| Reports grow but action does not improve | Measures have no decision owner | Remove or redesign non-actionable indicators |
Safety reminder
No productivity, availability, labour, consumption or cost KPI overrides product marking, machine limits, guarding, mounting, extraction, secure workholding, inspection, PPE or stop-work conditions. Never reward an operator for suppressing an abnormal event or using an abrasive beyond its safe condition.
Key takeaways
- Start with decisions, risks and accepted output.
- Give every KPI a controlled definition and owner.
- Balance safety, quality, flow, resources and cost.
- Keep first-pass, correction, rework, scrap and concession distinct.
- Segment comparable work before drawing conclusions.
- Use OEE only where its factors and scope are trustworthy.
- Set review limits from requirements, risk and local evidence.
- Validate the signal, contain risk and verify action before revising controlled work.
Grinding Problems
The Grinding Problems content appears on the following page of the printed handbook (page 614), outside this chapter extract.